The Operations menu offers the following:
- System monitor
- 3270 session manager (state tables only, if the 3270 option is installed)
- Custom server manager
- Statistics
- Immediate shutdown
- Quiesce shutdown
System Monitor
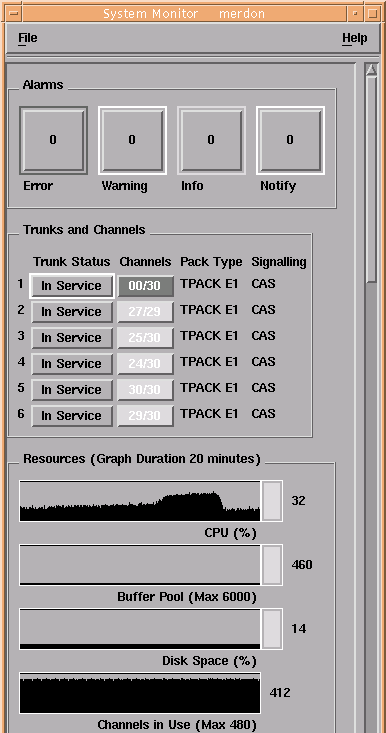
The system monitor is a real-time graphical display that shows:
- Alarm conditions
- Trunk and channel status
- CPU usage
- Buffer pool usage
- Hard disk usage
- Channel usage

Figure 1 shows how the System Monitor window reveals the state of the system at a glance. When resource usage exceeds a particular percentage, the indicators change color to alert you to potential problems. Using the monitor functions, you can block some or all of the channels on a trunk, quiesce the trunk, or disable it immediately.
The System Monitor window also indicates hardware and software alarm conditions, using color to indicate their severity. Further information about each alarm message can be viewed directly from the monitor window.
You can have the System Monitor window for a single Blueworx Voice Response system displayed on different display units, and you can have System Monitor windows for multiple Blueworx Voice Response systems displayed on a single display unit.
When you minimize the System Monitor window, the background color of the icon indicates the highest severity of alarm outstanding. For example, if a red alarm condition occurs, the icon changes to red.
3270 session manager (state tables only)
You can check the status of all 3270 sessions at a glance. You can also monitor the activity of an individual session. The information that is sent backward and forward is shown in real time. You can also see the sequence in which the server is handling screens and which fields the server is using on each screen. You can dynamically allocate sessions to 3270 servers, remove stalled sessions from service, and stop stalled 3270 servers: all without stopping Blueworx Voice Response.
You can have the 3270 Session Manager window for a single Blueworx Voice Response system displayed on different display units, and you can have 3270 Session Manager windows for multiple Blueworx Voice Response systems displayed on a single display unit.
Custom server manager
You can monitor the status of your custom servers. The available information about a custom server includes:
- The AIX process ID (PID)
- How often the custom server is used
- How many telephone calls are accessing it
- The last function that it executed
You can start and stop servers dynamically.
You can have the custom server Manager window for a single Blueworx Voice Response system displayed on several display units, and you can have custom server Manager windows for multiple Blueworx Voice Response systems displayed on a single display unit.
Statistics
After developing an application and starting to use it, you probably want to know how well it is working. Which options are used the most often? At what point do callers usually feel satisfied and disconnect? How often does a caller ask to speak with an agent?
Blueworx Voice Response automatically collects information about each call. The information includes how many calls access each application, where in the call flow a caller hangs up, and how often a specific event occurs. An event is anything you want to define as an event, such as the caller pressing a key.
Blueworx Voice Response automatically logs this information for you. You can view the information online, or have Blueworx Voice Response generate and print reports automatically at preset intervals or whenever you want them.
Blueworx Voice Response also maintains information about line usage, such as how much activity took place on each channel and what applications are being called, and statistics about the 3270 sessions and the links to all remote computers; these statistics include the maximum number of sessions available at any one time. You can view all this information online, or in printed form, in the same way as the call information.
In addition to the predetermined report formats that you can view online or print, you can also export the raw data from the DB2 database in which it is held, and process it to produce reports of your own.
Immediate shutdown and quiesce shutdown
Immediate shutdown closes each channel immediately and does not wait for any calls to stop.
With quiesce shutdown, Blueworx Voice Response monitors each channel and closes them separately as calls to each channel stop. Blueworx Voice Response then shuts down gracefully.